![]() A new report from USDA’s Economic Research Service outlines trends in the dairy industry in recent years and what the future might hold. Among the report’s findings:
A new report from USDA’s Economic Research Service outlines trends in the dairy industry in recent years and what the future might hold. Among the report’s findings:
– Per capita domestic commercial use of all dairy products (milkfat basis) has grown only 0.4 percent annually since 1995.
– Cheese has provided most of the dairy-product demand growth for many decades. Per capita cheese consumption has more than doubled since 1980 to just over 31.2 pounds in 2004, with most of the growth coming from sales of natural cheese.
– Butter demand has varied over the long run but has increased considerably since 1995.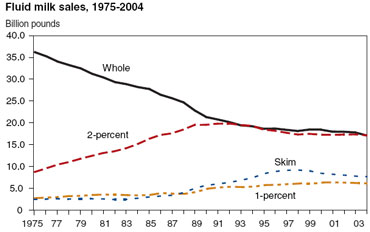
– Current beverage milk sales are virtually the same as in the mid-1980s, a sizable drop in per capita use. Contributing factors include a smaller share of children in the population, the increase in meals eaten away from home, children’s greater control over their food consumption, and stronger and more diverse competition from other beverages.
– Since 1980, the number of milk cows on farms in the U.S. has declined by about 16.5 percent and the number of dairy farms (operations) has fallen almost 75 percent. As a result, the average operation has more than tripled
in size, from 32 to 111 cows. 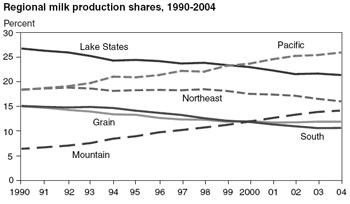
– The top 10 milk-producing States in 2004 were California, Wisconsin, New York, Pennsylvania, Idaho, Minnesota, New Mexico, Michigan, Texas, and Washington. This reflects the western shift in milk production.
– In some southern regions, such as the Southeast, where the climate is less conducive to milk production and forage quality problems persist, producers saw and continue to see their share of total production declining.
The report also studied the impact of trade agreements and government programs on dairy trends. Overall, it’s a very comprehensive study of the industry worth reading and could be useful to lawmakers as they consider development of new farm policy.